The famous names lose the leading role
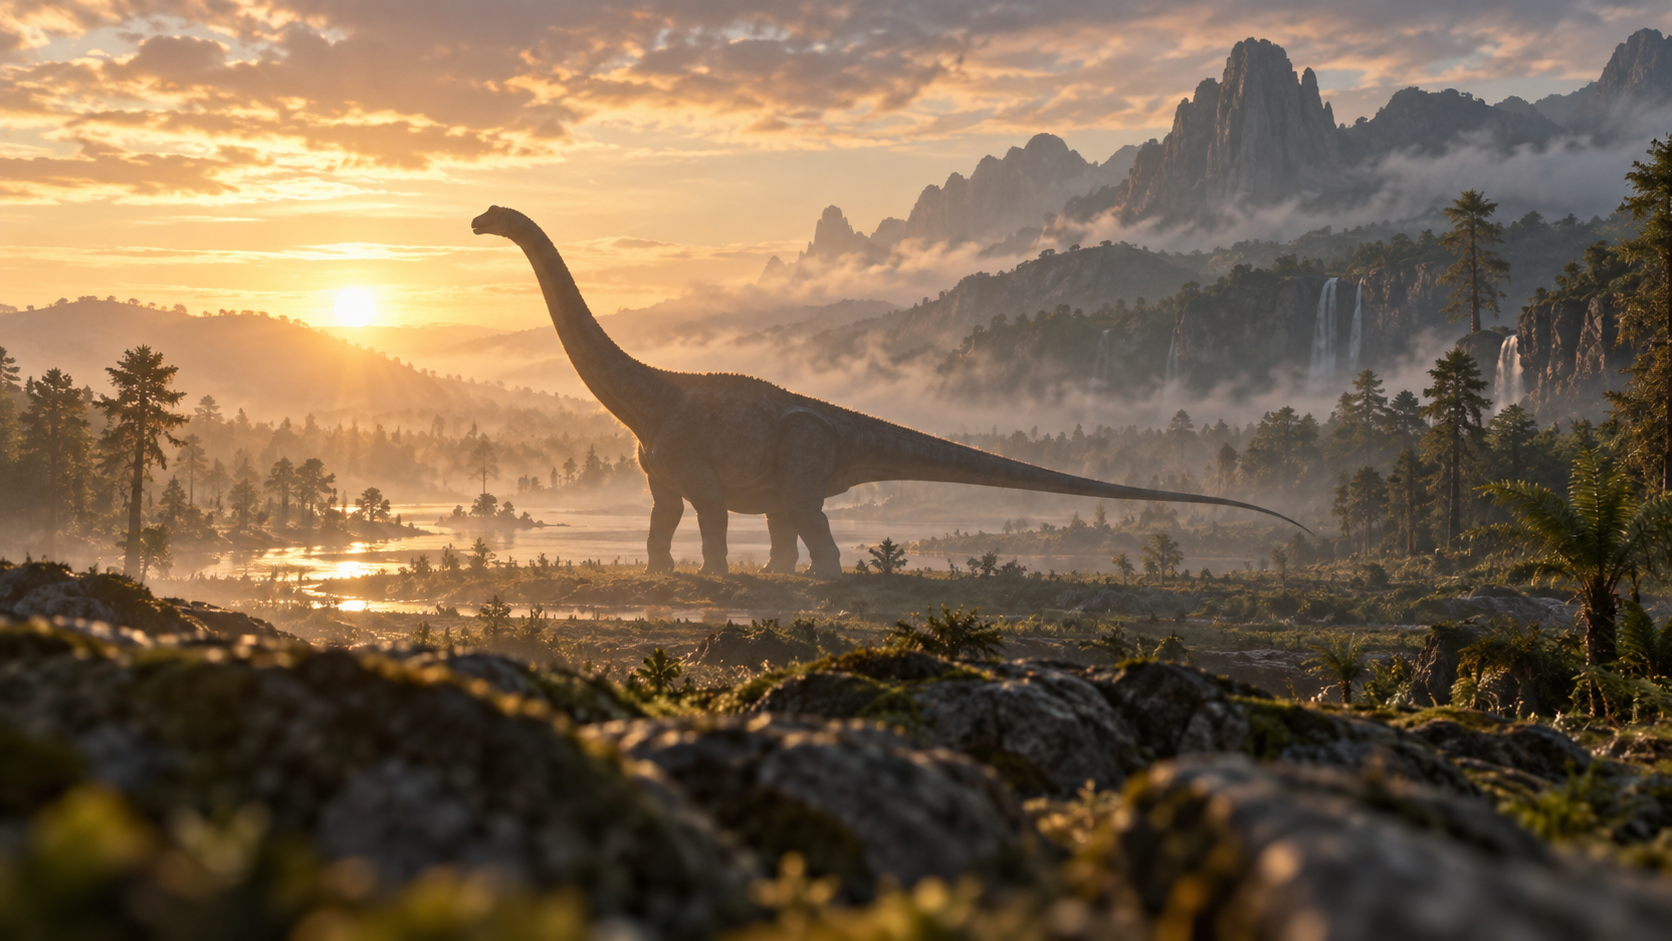
Diplodocus, Brontosaurus and Apatosaurus are well-known members of Diplodocoidea. This group of large plant-eaters includes three principal families: Diplodocidae, Dicraeosauridae and Rebbachisauridae. The first two together form Flagellicaudata.
Their diversity was high during the Late Jurassic. A sharp decline followed just before or during the transition into the Cretaceous, around 143.1 million years ago. Flagellicaudata were particularly affected by this turnover in animal life.
The story does not end there. In the Early Cretaceous, Rebbachisauridae move into the foreground, another family within the same wider group. Their diversification is associated with the later peak.
That is the crucial change on stage: the Diplodocoidea curve climbs again as the group's composition changes. One collective name hides the very different trajectories of the families within it.
The second summit is in the data
The team published its study on 10 September 2026 in the journal Fossil Record. It assembled 495 fossil occurrence records from databases and the scientific literature. Of these, 466 entered the analyses; the full collection represents 43 genera.
An occurrence record connects a particular animal group with a locality and a geological interval. The analysis counts different genera and their occurrences, not animal populations. It does not reveal whether ten or ten thousand animals crossed a landscape.
Diplodocus, for example, is a genus name. The researchers work at this level because identifying fossils down to individual species is often difficult. They investigate how diverse the group was and how that diversity changed over time.
How the finds are compared matters. A straightforward count and an analysis adjusted for unequal sampling produce different curves. That difference delivers the study's most striking twist.
A fossil treasure trove tilts the picture
The Morrison Formation is a heavyweight in the dataset. It supplies roughly 71 per cent of all the recorded occurrences and roughly 87 per cent of the Jurassic records. Such a large share of the finds strongly shapes the first view of diversity.
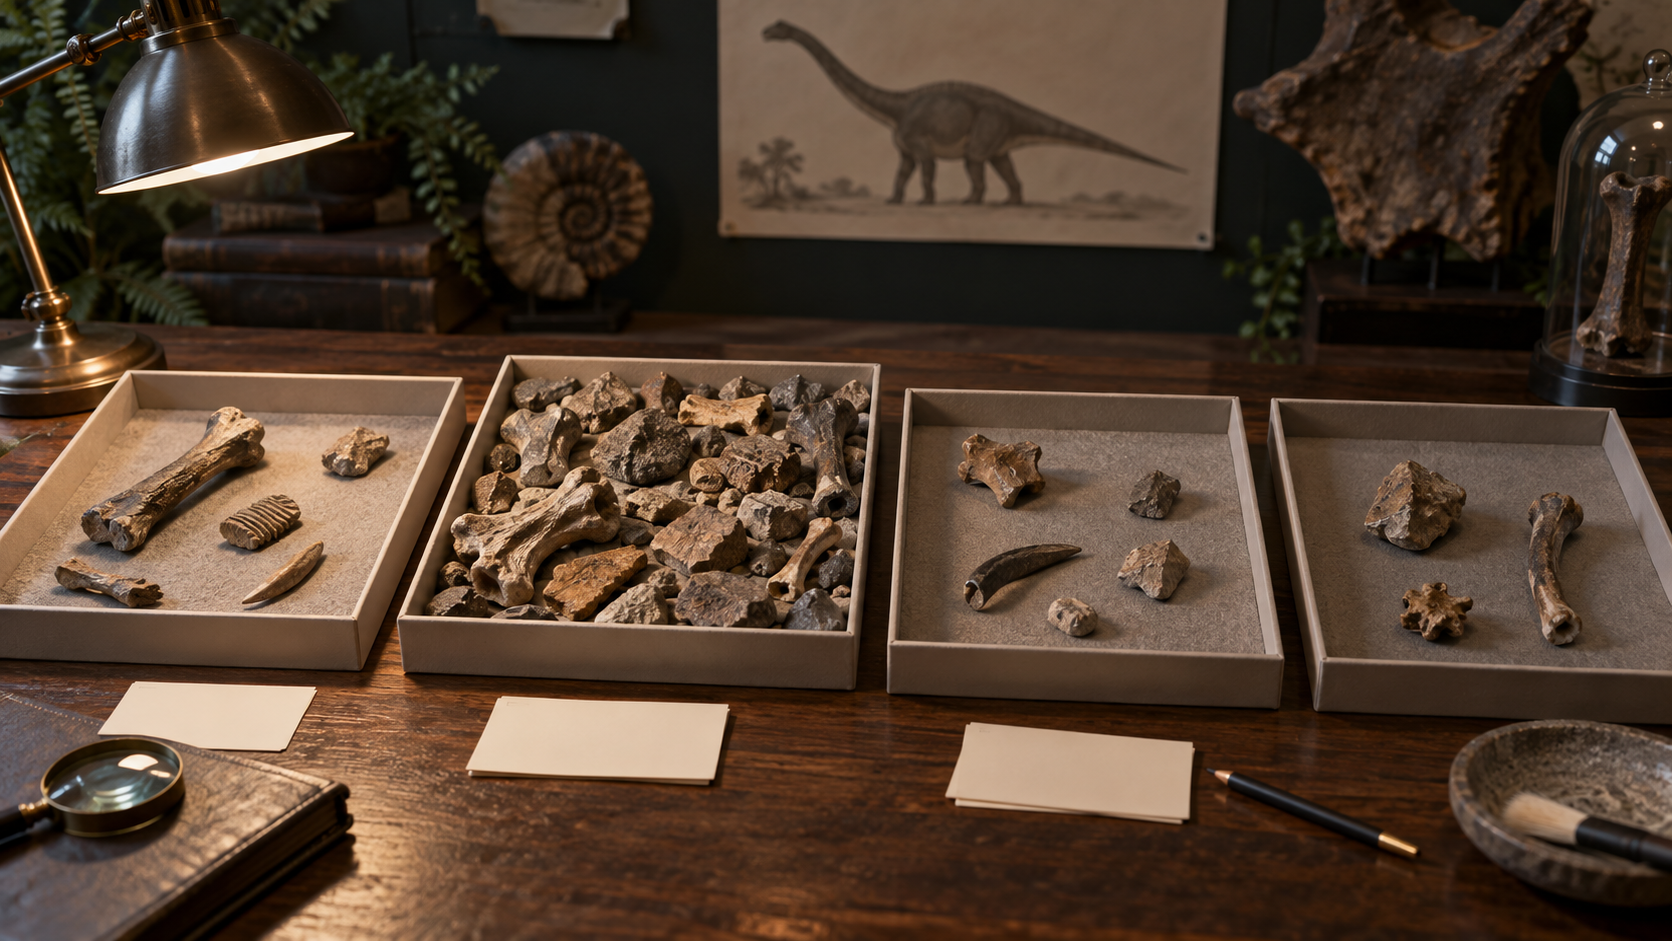
Where more fossils have been collected and studied, more genera come to light. A well-studied rock formation therefore carries more weight than less thoroughly investigated regions. That can amplify an apparent diversity peak without the animals having been equally diverse everywhere.
The team therefore statistically standardises the completeness of samples between time intervals. In plain terms, the intervals should enter the comparison on more equal terms. A particularly well-stocked fossil archive should not settle the contest by itself.
With this adjustment, the tested Morrison effect disappears in the corresponding model. The estimates show relatively stable diversity during the Late Jurassic, followed by the decline at the Cretaceous transition. The later peak falls in the Aptian.
Its height remains uncertain because the calculation also needs less precisely dated records, which can inflate the estimate. Even so, the analysis places the second peak clearly after the decline of Flagellicaudata.
The map reveals another divide
Geography also separates these long-necked dinosaurs. In the analysis, Flagellicaudata occur predominantly at higher latitudes in both hemispheres. Rebbachisauridae span the full latitudinal range recorded for Diplodocoidea, including equatorial and near-equatorial regions.
The difference goes beyond which family contained more genera. It also concerns where its members are recorded. The new diversity peak therefore has a distinct geographical profile as well as a different cast of dinosaurs.
A broad spread of latitudes does not mean rebbachisaurids lived everywhere: convincing records are absent or extremely rare in several major regions. The map of finds remains a map of traces that were preserved and investigated.
New leading players, unresolved causes
The authors discuss different ecological strategies and climatic constraints as possible explanations, but do not establish climate change as the cause of the boom. The shift between families is visible in the data; exactly why it unfolded this way remains a research question.
Rebbachisauridae outlasted both Diplodocidae and Dicraeosauridae. Their role therefore extends beyond a single high point in a diversity estimate. They carry a later chapter in this dinosaur group's history.
The finding overturns a simple tale of decline. A new diversity peak follows the crash, driven by a different family. In this analysis, the long-necked dinosaurs still have a major second act ahead of them.